Tomoharu YOKOTA Kazuhiko ASAKA Hideki
MATSUMOTO
Tsuyoshi YAMAGUCHI Chiharu KASAI
3 Weather dependency of the Link Quality of the Free Space Optical Transmission
System
(1) Weather condition and visibility
The standard visibility is defined as the distance where the black object is discriminated from the other on the horizon in the sunshine in the uniform sphere. Visibility is difficult to be measured directly and is calculated from the data measured by the optical equipment like the visibility meter now used. The distance where the light (white light of color temperature 2700K) is reduced to 5% after the transmission through the free space is defined as MOR (Meteorological Optical Range) and is used as similarly as the visibility of the meteorological term.
(a) Visibility distribution dependent on the weather condition
The change of the visibility affected by weather condition was measured
by the weather & visibility meter.
In Table 3-1, the weather condition is divided into four conditions of no rain, haze, fine rain and rain, and the percentage of the visibility under each condition is shown.
In this measurement the visibility less than 1km is only under the condition
of rain and the percentage is rare, only 0.32%. By the way the strongest
rainfall was 42.6mm/hr and the visibility was 0.16km in this measurement.
Figure 3-1 shows the relation between rainfall and visibility. The visibility
gets so shorter as that the rainfall is stronger, but it is difficult to
get the visibility directly from the rainfall. Accordingly it is necessary
to get the propagation loss of the beam from the visibility in order to
make a link design.
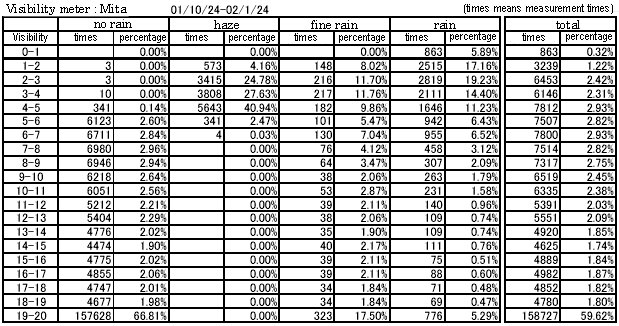
Table 3-1 Percentage of Visibility under Weather Condition
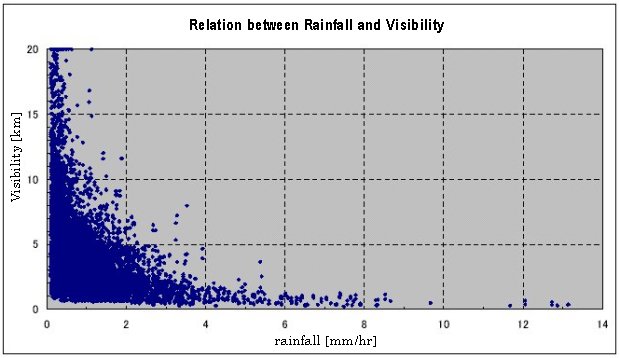
Figure 3-1 Relation between Rainfall and Visibility
(b) Result of measurement of visibility, reception power and bit error rate
Figure 3-2 shows the result of the measurement of visibility, reception
power and bit error rate in the rain at Mita for a month of December, 2001.
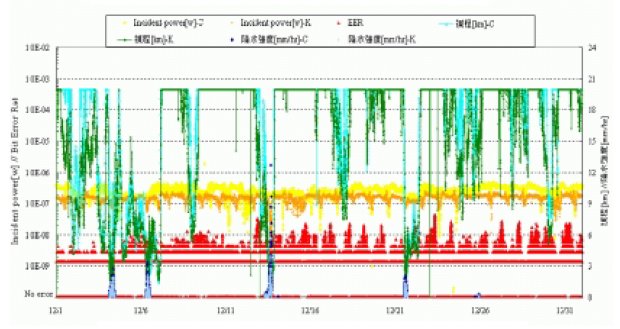
Figure 3-2 Result of Measurement of Visibility, Reception Power and
Bit Error Rate in December, 2001
The visibility changes similarly at Mita and Takanawa macroscopically.
The visibility of both points is much reduced at the weak rain (about 3mm/hr
in this figure) and the changes of rainfall and visibility coincide with
each other. But the visibility is also reduced in no rain and this will
be caused by fog and haze. This data verifies the relation between the
visibility and the weather condition on the whole.
The anxiety is bit error rate when the Free Space Optical Transmission
System is setup. In this measurement the worst bit error rate was 4×10
-8 and it is sufficiently good for the communication link though the weather
was relatively fine. But the change of bit error rate does not always coincide
with that of rainfall and visibility, and appears rather intermittently
and continuously. The reason is not clear now.
(2) Propagation loss and visibility
(a) Estimation formula of propagation loss
The transmission quality of the Free Space Optical Transmission System
is affected by aerosol and weather condition in the air. The visibility
is generally used in order to estimate the influence and is defined as
the distance where the black object is discriminated from the other on
the horizon in the sunshine in the uniform sphere. It is measured by weather
bureaus in every place and is the data for the visible light. The visibility
data for the visible light is used for the estimation of propagation loss
because the infrared of about 800nm is near to the visible light. The estimation
formula L (dB/km) of the air using the visibility is expressed in two types
of formulae. The one is formula (1) using the visibility, the other is
formula (2) including the influence of wave length.
・not including the influence of wave length
 |
(dB/km) |
formula (1) |
・including the influence of wave length
 |
(dB/km) |
formula (2) |
q = 0.585 V 1/3
L : propagation loss (dB/km) V : visibility (km) λ : wave length (nm)
(b) Relation between visibility and reception power
Figure 3-2 shows the relation between visibility and reception power that
was measured for about 6 months (October, 2001 to March, 2002) between
Mita and Takanawa 1.2km apart.
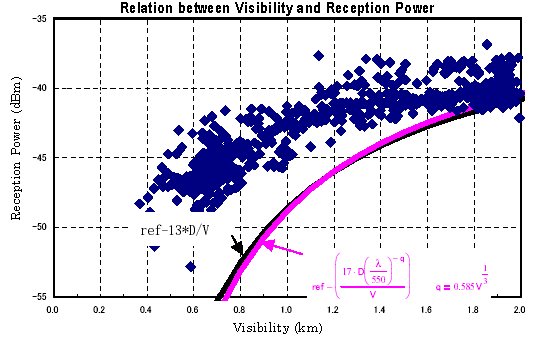
Figure 3-2 Relation between Visibility and Reception Power (Mita)
The black line means the theoretical curve of formula (1) and the red line means the theoretical curve of formula (2). They were calculated based on transmit power -33dBm and distance 1.2km.
Comparing with the measured data and the theoretical curves, the theoretical
curves go along the lower limit value of the measured data. Accordingly
it is verified that both formulae are suitable for the estimation.
The results of formula (1) and (2) have not so large difference under the
condition of transmission distance 2km and wave length about 800nm, and
the theoretical result is the same even if any formula is used for the
link design. The simple formula (1) is easy to be used for the estimation
of propagation loss.
(3) Propagation loss and transmission quality
(a) Relation between reception power and bit error rate
Figure 3-3 shows the relation between reception power and bit error rate.
The link-down did not happen and the worst bit error rate was 4.3×10
-8 for about three months since October 24, 2001 to January 27, 2002. The
link quality is very high for wireless system.
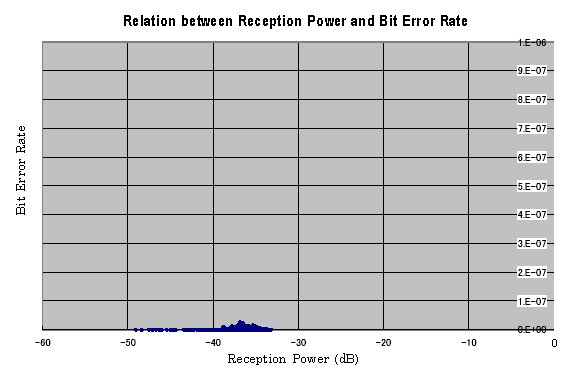
Figure 3-3 Relation between Reception Power and Bit Error Rate
(b) Scintillation
Fluctuation of reception power level caused by the density deviation of
the air is scintillation.
Table 3-2 shows the example of scintillation obtained in this measurement.
| Date |
the lowest value
of visibility |
weather |
the highest temperature |
the lowest temperature |
the worst value of BER |
scintillation |
| 2001/12/1 |
20km (Mita)
20km (Takanawa) |
no rain 100% |
12.3℃ |
5.9℃ |
1.70E-08 |
4〜8dB |
| 2001/12/9 |
6.5km (Mita)
5.7km (Takanawa) |
no rain 100% |
12.6℃ |
5.7℃ |
1.00E-08 |
3〜8dB |
| 2001/12/1 |
368km (Mita)
272km (Takanawa) |
no rain 55.6%
haze 44.4% |
13.1℃ |
7.0℃ |
5.80E-09 |
1〜3dB |
| 2001/12/2 |
15.1km (Mita)
6.25km (Takanawa) |
no rain 100% |
15.2℃ |
3.4℃ |
4.30E-08 |
1〜2dB |
Table 3-2 Measurement of Scintillation
|
